The week of January 11, 2026, delivers a critical batch of economic data. December CPI, existing home sales, and November retail sales will test the narrative of a soft landing. Markets are bracing for signs that inflation is sticking while housing cools.
The Big Picture

The Federal Reserve has been walking a tightrope between persistent inflation and a labor market that refuses to break. December CPI, with consensus estimates of 0.3% month-over-month for both headline and core, and a 2.7% year-over-year rate for both, offers no clear relief. Housing, which accounts for a third of the CPI basket, remains the primary upward driver. Meanwhile, December existing home sales are projected at 4.23 million SAAR, a modest uptick from 4.13 million the prior month, but still far below pre-pandemic levels.

New home sales for September and October will also be in focus, with October expected to hit 714,000 SAAR. That figure, if realized, would signal stabilization after months of decline. The combination of sticky inflation and a softening housing market presents the Fed with a dilemma: prioritize price control or support a key economic sector?
“Core CPI at 2.7% annual and existing home sales at 4.23 million paint a picture of housing stagflation.”
By the Numbers

- December headline CPI: Expected 0.3% monthly increase, 2.7% year-over-year.
- December core CPI: Also projected at 0.3% monthly and 2.7% annual.
- December existing home sales: Consensus 4.23 million SAAR, up from 4.13 million.
- October new home sales: Estimated at 714,000 SAAR.
- November retail sales: Forecast 0.4% monthly gain.
- NFIB Small Business Optimism: December reading due Tuesday; no specific consensus.

Why It Matters
This week isn't just another data dump; it's a stress test for the narrative that the U.S. economy can disinflate without breaking. If core CPI holds at 2.7%, the Fed will have cover to keep rates higher for longer. But if home sales undershoot, markets will start pricing in earlier cuts.
Housing is the canary in the coal mine. Existing home sales, while slightly up, remain historically low for an expansion cycle. Limited supply and elevated prices are squeezing first-time buyers. Builders face stubbornly high material and labor costs, reflected in the January NAHB index expected at 40—still in pessimistic territory.
Potential winners: cash-rich investors who can negotiate deals on distressed properties. Losers: mortgage-dependent buyers trapped between high rates and rigid prices.
What This Means For You
- 1For investors: CPI and home sales data could spark volatility in bonds and homebuilder stocks. Consider reducing exposure to residential REITs if housing data disappoints.
- 2For homebuyers: If new home sales fall below 700,000, you may find better negotiating leverage with builders looking to move inventory.
- 3For industry operators: The New York and Philly Fed manufacturing surveys (readings of 1.0 and -5.0, respectively) point to industrial contraction. Adjust supply chains accordingly.
What To Watch Next
Thursday brings weekly jobless claims (consensus 208,000) and the New York and Philly Fed manufacturing surveys, offering clues on labor market and industrial health. Friday caps the week with December industrial production (consensus +0.2%) and the January NAHB index (40).
The Fed's Beige Book, out Wednesday, will provide anecdotal color on regional economies. Investors will look for signs that the housing slowdown is spilling into other sectors.
The Bottom Line
This week won't define the year, but it will set the tone for Q1. If inflation stays sticky and housing softens, the Fed will be caught between two fires. The key is new and existing home sales: if they confirm a downtrend, markets will start pricing in rate cuts by mid-2026. Brace for volatility.
Deep Dive: Implications for Investors and Operators
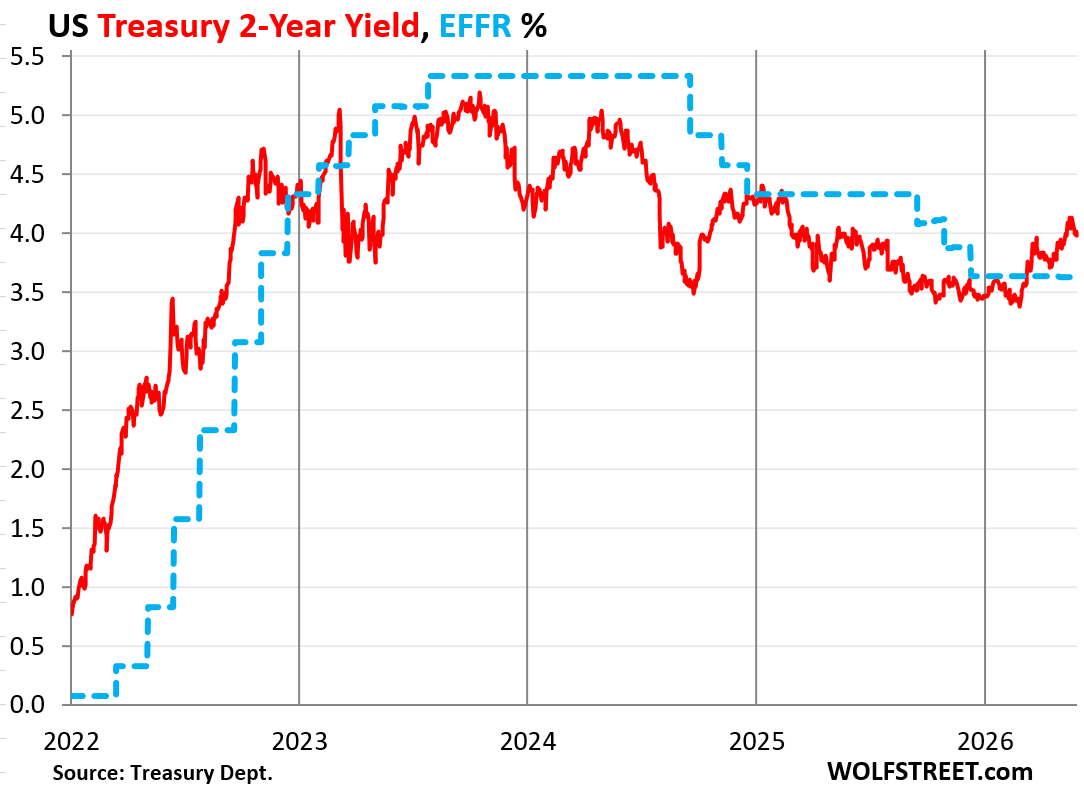
The interplay between inflation and housing is not just academic. For fixed-income investors, a core CPI at 2.7% reinforces the likelihood that the Fed keeps the federal funds rate in the current 4.25%-4.50% range through the first half. This implies 10-year Treasury yields could oscillate between 4.0% and 4.5%, with an upward bias if housing data surprises to the upside. Conversely, a drop in new home sales below 700,000 could trigger a yield compression as markets price in cuts.
In the housing sector, builders with strong balance sheets like DR Horton or Lennar are better positioned to weather the storm, but their margins will narrow if material costs don't ease. Residential REITs like Equity Residential face pressure from stagnant rents. A tactical strategy for risk-tolerant investors is to sell put options on the XHB ETF (homebuilders) if CPI doesn't surprise to the upside, betting that the market has already priced in the worst.
For real-sector operators, the industrial contraction signaled by the New York Fed (1.0) and Philly Fed (-5.0) surveys suggests demand for construction materials like lumber and steel could weaken. Building supply companies like Builders FirstSource should monitor inventories and dial back production. On the other hand, home improvement retailers like Home Depot could benefit if homeowners opt to renovate rather than move, a typical behavior in slow housing markets.
Finally, Wednesday's Beige Book will be crucial for gauging the Fed's tone. If regional reports highlight a broad slowdown in credit and investment, markets could interpret it as a sign that restrictive policy is working, paving the way for a rate cut at the March meeting. But if the emphasis is on persistent services inflation, the Fed's patience will extend. Either way, volatility will be the protagonist.
Long-Term Outlook
Beyond this week, the 2026 outlook hinges on labor market evolution. If jobless claims stay below 220,000, the Fed has room to wait. But if they exceed 250,000, the focus will shift from inflation to employment, and rate cuts will accelerate. Industrial production, with a consensus of +0.2% in December, is another thermometer: a negative reading would confirm manufacturing is in a technical recession, increasing pressure on the Fed.
On the housing front, the supply of existing homes remains the Achilles' heel. With mortgage rates still near 7%, homeowners with low rates (3-4%) have no incentive to sell, keeping supply constrained. Until rates drop significantly, the existing home market will stay depressed. New homes, however, could benefit from builder incentives like price reductions or preferred financing, explaining the stabilization at 714,000 units.
For long-term investors, the conclusion is clear: sector diversification is key. Portfolios overweight in technology and growth could suffer if rates stay high, while defensive sectors like healthcare and utilities offer shelter. In fixed income, investment-grade corporate bonds with short maturities (2-3 years) offer attractive yields without excessive duration risk. And for the bold, Treasury Inflation-Protected Securities (TIPS) remain a reasonable hedge if inflation doesn't ease.
Practical Takeaway
This week is a microcosm of 2026's dilemmas: persistent inflation, fragile housing, and a Fed with no margin for error. December's data won't resolve the debate, but it will tip the scales. Investors should prepare for two scenarios: if inflation surprises to the downside (below 2.5% annual), markets will rally with bonds and stocks; if housing collapses (existing sales below 4.0 million), recession panic will dominate. In either case, liquidity and flexibility will be the best allies.